In my previous post, I covered the data collection and analysis side of IoT – but without actually using an IoT device. In this post, I use some of the same backend technologies but with a real IoT device, the Raspberry Pi 2 Model B! While individual steps may be covered elsewhere, this post stitches together the entire end-to-end.
The first step was identifying something in the physical world I wanted to understand better. A number of things came to mind:
- Effectiveness of the heating in my house: It feels like the heat in my basement does not work that well. Is this accurate, and does indeed the indoor temperature fluctuate with the outdoor temperature?
- Correlation between how well my son sleeps and the internal weather conditions (temperature and humidity): We get plenty of advice on how warm and humid to keep my son’s nursery. Is there a correlation between these conditions and how well he sleeps?
- Whether I left the lights or stove on: Can I preempt my house burning down? :)
- Whether a bulb is fused: There are a number of lights I have on timer or don’t check that often. Can I confirm the lights are coming on as expected and get notified when they burn out?
- Fuel economy impact of different routes to work and my driving style: How much do my driving choices really impact fuel economy?
For this exercise, I’ve gone with the first one. I can do that with just one Raspberry Pi, and it is all indoor. Some of the other ones would have required different physical devices. The one about my son’s sleep would require also using the API for my Nest Cam. And, the one around driving would probably require a device that connects to my car’s OBD-II system. That said, my single Raspberry Pi is effectively acting as two devices – sending the indoor temperature from its sensor (myBmp280) and sending the outdoor temperature using the OpenWeatherMap service (bellevueSensor).
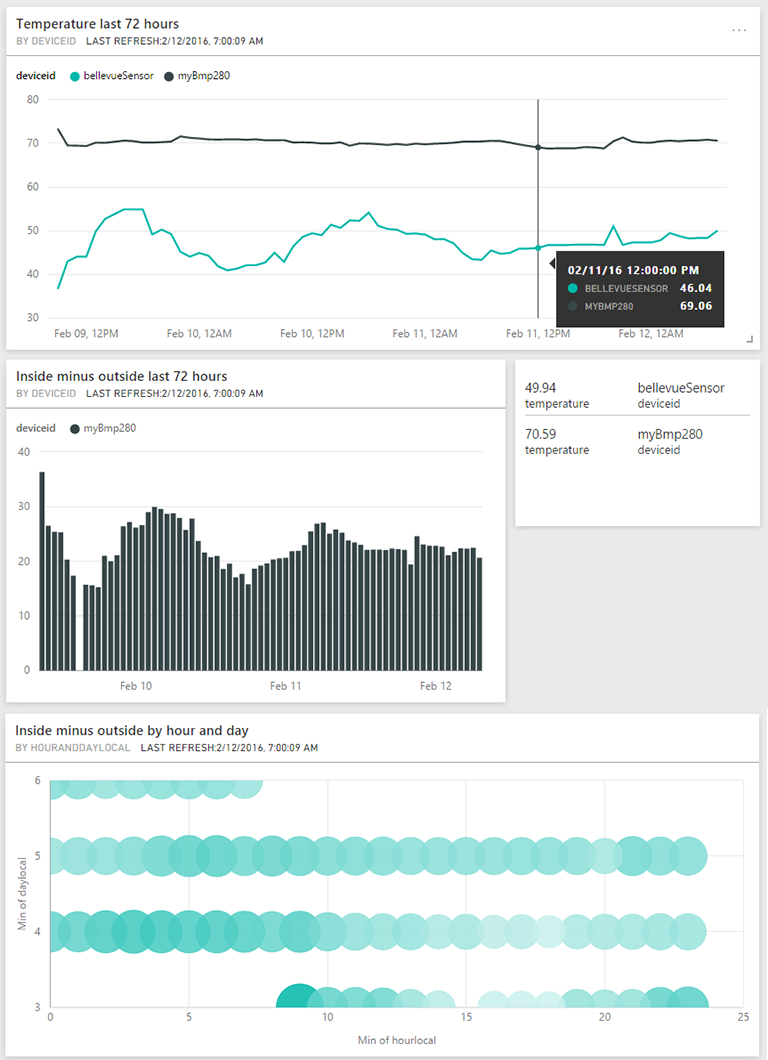
I’ve learned from this that our heating system in the master bedroom works really well and has maintained a consistent 70 degrees Fahrenheit even as the outdoor temperature fluctuates. I will next try it out in my son’s nursery and then the basement.
In the remainder of this post:
- Choose an IoT device
- Set up the Raspberry Pi
- Write the app
- Deploy the app to the Pi
- Pump the data into Azure IoT Hub
- Process real-time streams with Azure Stream Analytics
- Visualize the data with Power BI
- Next
Choose an IoT device
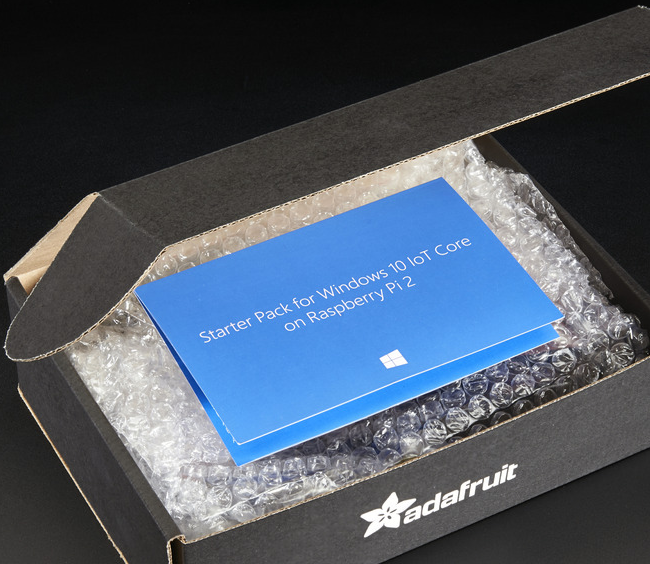
I knew I would ultimately want to dabble with running both Linux and Windows 10 IoT Core on my device, so I quickly landed with the Microsoft IoT Pack for Raspberry Pi 2 by Adafruit. Wait, Windows runs on the Raspberry Pi? It’s perhaps surprising at first but then less so after thinking about it. Windows 10 runs on ARM devices such as Windows Phone, and the Raspberry Pi is also ARM-based.
For actually developing the application, I went with Windows 10 and the Universal Windows Platform (UWP). UWP applications run on all flavors of Windows 10, including those that run on ARM. The platform supports application development in C++, .NET (including C#) and JavaScript. I chose to develop in Visual Studio and C#, which in turn leverages the relatively new .NET Core Framework. The .NET Core framework is a modular version of .NET that ships as NuGet packages and can actually be packaged with your application instead of requiring a machine wide administrative install. I admittedly had a learning-related motive for this. My team is responsible for tooling ASP.NET Core, which is based on the same .NET Core framework. I wanted to understand better how the .NET Core works on devices, not just servers.
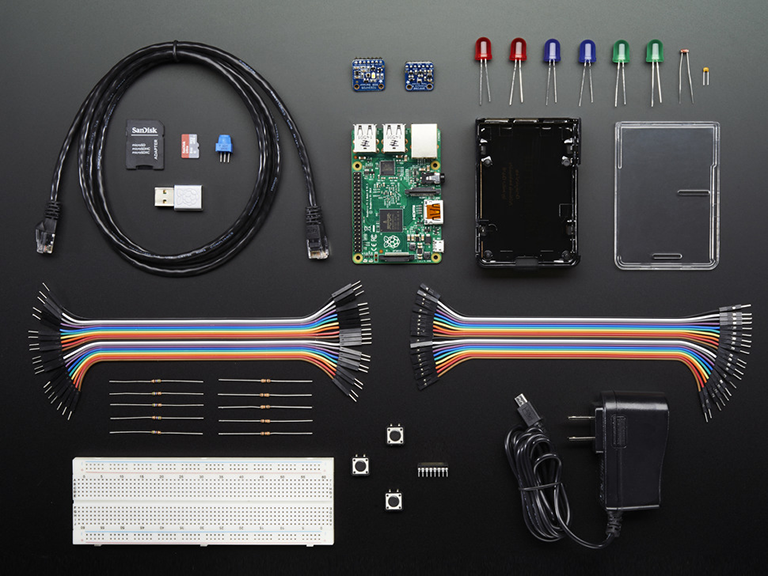
As for the hardware, I chose the kit instead of the individual components for a few reasons:
- I’ve read that not every Raspberry Pi component works with Windows 10 IoT Core. I had the peace of mind that the components in the kit would just work.
- There is a sample project already for accessing the temperature sensor from C#.
- I am a relative novice on the hardware and device side, so I wanted components were relatively pre-assembled. For example, the BMP280 temperature sensor included in the kit comes with the headers already soldered on. So, I can just drop it in the breadboard.
Set up the Raspberry Pi
Setting up the Raspberry Pi is documented quite well, so I will not rehash it here. In fact, all the steps documented in Lesson 1 worked perfectly.
Write the app
For writing the app, I was fortunate there is a great article and sample code for reading temperature from the BMP280 sensor.
That said, I forked the code and made a number of changes:
1. Mocking
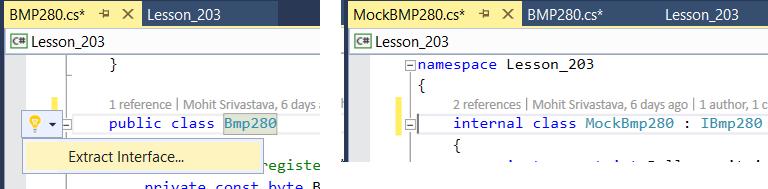
I wanted a way to run as much of my app locally as possible. Since UWP’s run on x64 and x86, I could just F5 and run it locally. The one hangup is that I don’t have a BMP280 temperature sensor connected to my PC. So, I took a technique I learned from web development. I extracted the interface for the sensor API (using Visual Studio’s Extract > Interface feature) and then created a mock implementation that returns random values. That way, I can test the logic of my app without deploying it to the Pi. I only used the mock implementation if I am running on x64 or x86.
2. Reading outside weather
I needed to send both outside temperature, as well as the indoor temperature as measured by the sensor. I changed my “mock” class to no longer technically be a mock but rather use the OpenWeatherMap service API. So, I ended up with two “devices” in my code – a virtual one that mirrors the outside Bellevue, WA temperature and another that reads from the actual sensor on my Pi. When running on my desktop (i.e. x64 or x86), I only instantiate the virtual one. That way, I can still run and test my app on my desktop. When compiling for ARM (i.e. the Pi) though, I instantiate both.
// Always add this "virtual" device
_devices.Add(new Device { Reader = new MockBmp280((string)secrets["openWeather"]), IotHubName = "bellevueSensor", IotHubKey = (string)secrets["bellevueSensor"] });

// Only add this one if the PI compilation symbol is defined
#if PI
_devices.Add(new Device { Reader = new Bmp280(), IotHubName = "myBmp280", IotHubKey = (string)secrets["myBmp280"] });
#endif
3. Reading the sensor(s) on an interval
The original project simply reads the sensor ten times and then exits. Obviously, I wanted to read the sensor indefinitely on a regular interval. I create a timer per sensor (virtual or physical):
foreach (var device in _devices)
{
    // ...
    var timer = new Timer(async e =>
    {
        // ...
        await deviceClient.SendEventAsync(message);
        Debug.WriteLine("{0} > Sending message: {1}", DateTime.Now, messageString);
    }, null, TimeSpan.FromMilliseconds(0), TimeSpan.FromMinutes(10));
    // Necessary so timers are not garbage collected
    _timers.Add(timer);
}
Deploy the app to the Pi
This step is documented reasonably well. However, here are a few notes:
- I was able to deploy straight from Visual Studio, as mentioned in in the article. But, I had to deploy using the Release (instead of Debug) configuration.
- To survive power outages and reboots, I used PowerShell commands to make my app start automatically when the Pi boots up.
Pump the data into Azure IoT Hub
In my previous post, I used Azure Event Hubs for ingestion. However, Azure Iot Hub is optimized for the use case of gathering telemetry from devices. The following benefit especially resonates: “Security: Provides per-device identity and revocable access control”.
[UPDATE: 2/19/2016] My colleague Brady Gaster pointed out I left off a number of steps around device registration that precde the below code sample. For example, where do device.IotHubName and device.IotHubKey come from below? I may elaborate in a future post. But, in the meantime, the following two articles are especially helpful:
- Get started with Azure IoT Hub for .NET - I followed all the steps here except for Create a device identity. The reason is registration can be done more easily with the Device Explorer tool (next link below).
- How to use Device Explorer for IoT Hub devices
For my solution, IoT Hub’s per-device identity is a perfect abstraction. I modeled the Pi as two devices – one virtual (for the Bellevue outdoor temperature) and one real (for the temperate as measured from the sensor). I didn’t have to do it that way. I could have had the virtual one running in the cloud as a WebJob, but I just chose to run both on the Pi. Regardless, I would have still had two device identities.
foreach (var device in _devices)
{
    // ...

    var deviceClient = DeviceClient.Create(
        IotHubUri,
        new DeviceAuthenticationWithRegistrySymmetricKey(device.IotHubName, device.IotHubKey),
        TransportType.Http1);

    // ...

    var messageString = JsonConvert.SerializeObject(telemetryDataPoint);
    var message = new Message(Encoding.ASCII.GetBytes(messageString));

    await deviceClient.SendEventAsync(message);
}
Process real-time streams with Azure Stream Analytics
After pushing the data to IoT Hub, the next step is to have this data flow into Stream Analytics. Ingesting data from IoT Hub into Stream Analytics is covered on the Azure blog. So, I will not rehash those details. However, I did author a query – which transforms the input from IoT Hub into an output for Power BI – to meet the following goals:
- Aggregate the raw data by time window, to manage the amount of data that has to flow into Power BI. The GROUP BY TumblingWindow(hh, 1), weather.deviceId clause below accomplishes that, while also grouping by deviceId to preserve the ability report on devices over different time dimensions.
- Transform the data into a form that contains the dimensions and measures to report on in Power BI.
Ultimately, I ended up with the following query which does meet the goals. That said, I am not thrilled with having to duplicate DATEADD(hh, CAST(MAX(utcOffset) as bigint), System.Timestamp) to have the various time dimensions show as local time. But, I could not find a way to alias this fragment that would preserve query behavior. Let me know in the comments if there is a more succinct way to write the below query:
-- sub-query for obtaining avg outside temperature
WITH Outside AS
(
    SELECT
        Avg(temperature) AS OutsideTemperature,
        System.Timestamp as OutsideTime
    FROM
        weather TIMESTAMP BY EventEnqueuedUtcTime
    WHERE deviceId LIKE 'bellevueSensor'
    GROUP BY
        TumblingWindow(hh, 1), deviceId
),
-- select the avg inside temperature per device and join in the outside temperature
Sensor AS
(
    SELECT
      System.Timestamp as Time,
      weather.deviceId as DeviceId,
      Avg(weather.temperature) as Temperature,
      Avg(weather.pressure) as Pressure,
      MAX(weather.utcOffset) as UtcOffset,
      DATEADD(hh, CAST(MAX(weather.utcOffset) as bigint), System.Timestamp) TimeLocal,
      CASE DATEPART(weekday, DATEADD(hh, CAST(MAX(weather.utcOffset) as bigint), System.Timestamp))
        WHEN 1 THEN 'Sunday'
        WHEN 2 THEN 'Monday'
        WHEN 3 THEN 'Tuesday'
        WHEN 4 THEN 'Wednesday'
        WHEN 5 THEN 'Thursday'
        WHEN 6 THEN 'Friday'
        ELSE 'Saturday'
      END AS DayStrLocal,
      CASE MONTH(DATEADD(hh, CAST(MAX(weather.utcOffset) as bigint), System.Timestamp))
        WHEN 1 THEN 'January'
        WHEN 2 THEN 'February'
        WHEN 3 THEN 'March'
        WHEN 4 THEN 'April'
        WHEN 5 THEN 'May'
        WHEN 6 THEN 'June'
        WHEN 7 THEN 'July'
        WHEN 8 THEN 'August'
        WHEN 9 THEN 'September'
        WHEN 10 THEN 'October'
        WHEN 11 THEN 'November'
        ELSE 'December'
      END AS MonthStrLocal,
      DATEPART(hour, DATEADD(hh, CAST(MAX(weather.utcOffset) as bigint), System.Timestamp)) as HourLocal,
      DATEPART(weekday, DATEADD(hh, CAST(MAX(weather.utcOffset) as bigint), System.Timestamp)) as DayLocal,
      (DATEPART(hour, DATEADD(hh, CAST(MAX(weather.utcOffset) as bigint), System.Timestamp)) * 10 + DATEPART(weekday, DATEADD(hh, CAST(MAX(weather.utcOffset) as bigint), System.Timestamp))) as HourAndDayLocal,
      MONTH(DATEADD(hh, CAST(MAX(weather.utcOffset) as bigint), System.Timestamp)) as MonthLocal,
      YEAR(DATEADD(hh, CAST(MAX(weather.utcOffset) as bigint), System.Timestamp)) as YearLocal
    FROM
        weather TIMESTAMP BY EventEnqueuedUtcTime
    GROUP BY TumblingWindow(hh, 1), weather.deviceId
)
SELECT Sensor.*, Outside.OutsideTemperature, (Sensor.Temperature - Outside.OutsideTemperature) As InsideMinusOutsideTemp
INTO weatherhourly
FROM Sensor LEFT JOIN Outside On DateDiff(hh, Sensor, Outside) = 0
On the output side, I directly push to Power BI.
Note: This is ideal for real-time but currently does introduce some limitations for analysis. Specifically, you cannot join other datasets. The workaround is to ensure the dataset is de-normalized. The above query from Stream Analytics does just that, creating a number of time dimensions, for example.
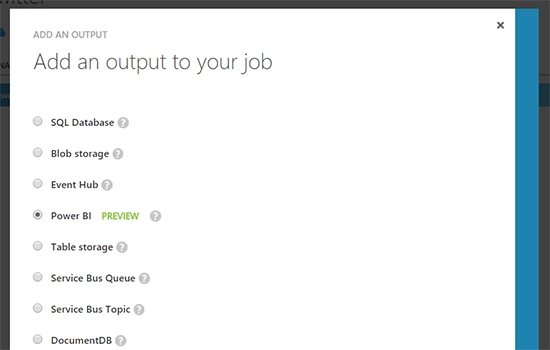
Visualize the data with Power BI
The last part is building the Power BI dashboard off of the dataset that gets populated by Stream Analytics. For real-time data, there are two options. The first is to generate a report and then pin the various widgets to a dashboard. The limitation here is that you cannot limit the widgets to a time offset from now. In other words, “last 24 hours”, “last week”, etc. are not possible. The second option, and the one I primarily used, is to use the very cool Q&A feature:
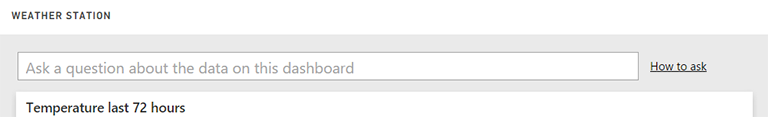
Here are the exact questions I typed to build each of the widgets on the dashboard:
- Temperature last 72 hours: average temperature and deviceid by timelocal where time is from 72 hours before now to current hour sorted by timelocal as line
- Inside minus outside last 72 hours: average insideminusoutsidetemp and deviceid by timelocal where deviceid is ‘myBmp280’ and time is from 72 hours before now to current hour sorted by timelocal as column chart
- Current temperature: show temperature where time is current hour and deviceid is ‘myBmp280’ or ‘bellevueSensor’ as card
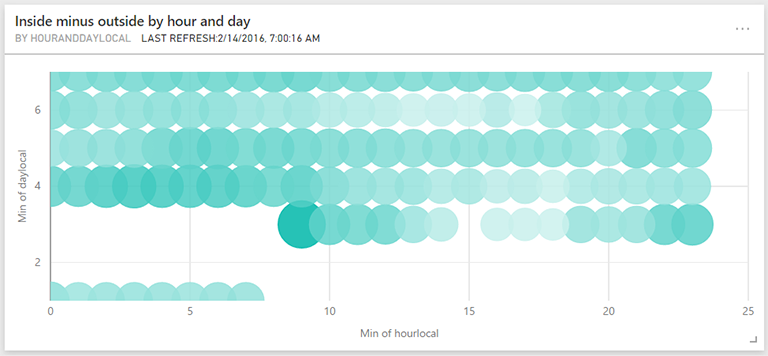
In addition, I created a bubble chart to show the largest delta between inside and outside temperature by time of day. A bubble chart is a scatter chart with the bubble size representing an additional dimension:
For this, I used the chart builder:
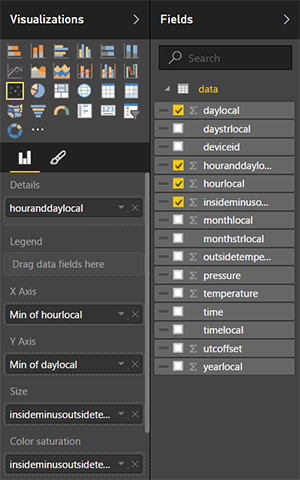
Note the use of the houranddaylocal field, which I generated earlier in Stream Analytics with hour x 10 + day. This ensures a unique value for each hour and day combination, each of which ends up being a bubble and the dimension on which we add up the counts. Also note, that the columns and rows are aggregate values. This effectively makes them categorical. I could have chosen one of many functions – Min, Max, Avg – and they would have all had the same effect in this case. With an hour window, all rows share the same hourlocal and daylocal since the incoming data is aggregated by hour.
Next
Unfortunately, I cannot share the finished dashboard since right now sharing is limited to users in the same organization only. But, I captured the image at the top of the article.
Look for future posts possibly covering cloud to device interactions, different types of sensors and more.
Hope this post was helpful!